What actually moves Steam launch revenue?
Published 2026-07-01 · Causal-forest estimates over 10,403 launches · Cite this research
Most "what should I build before launch" advice is correlation dressed up as strategy. We ran Wager-Athey causal forests — the honest way to ask "what would this game's week-1 revenue have been with the feature vs. without" — over 10,403 Steam launches. Three findings survived:
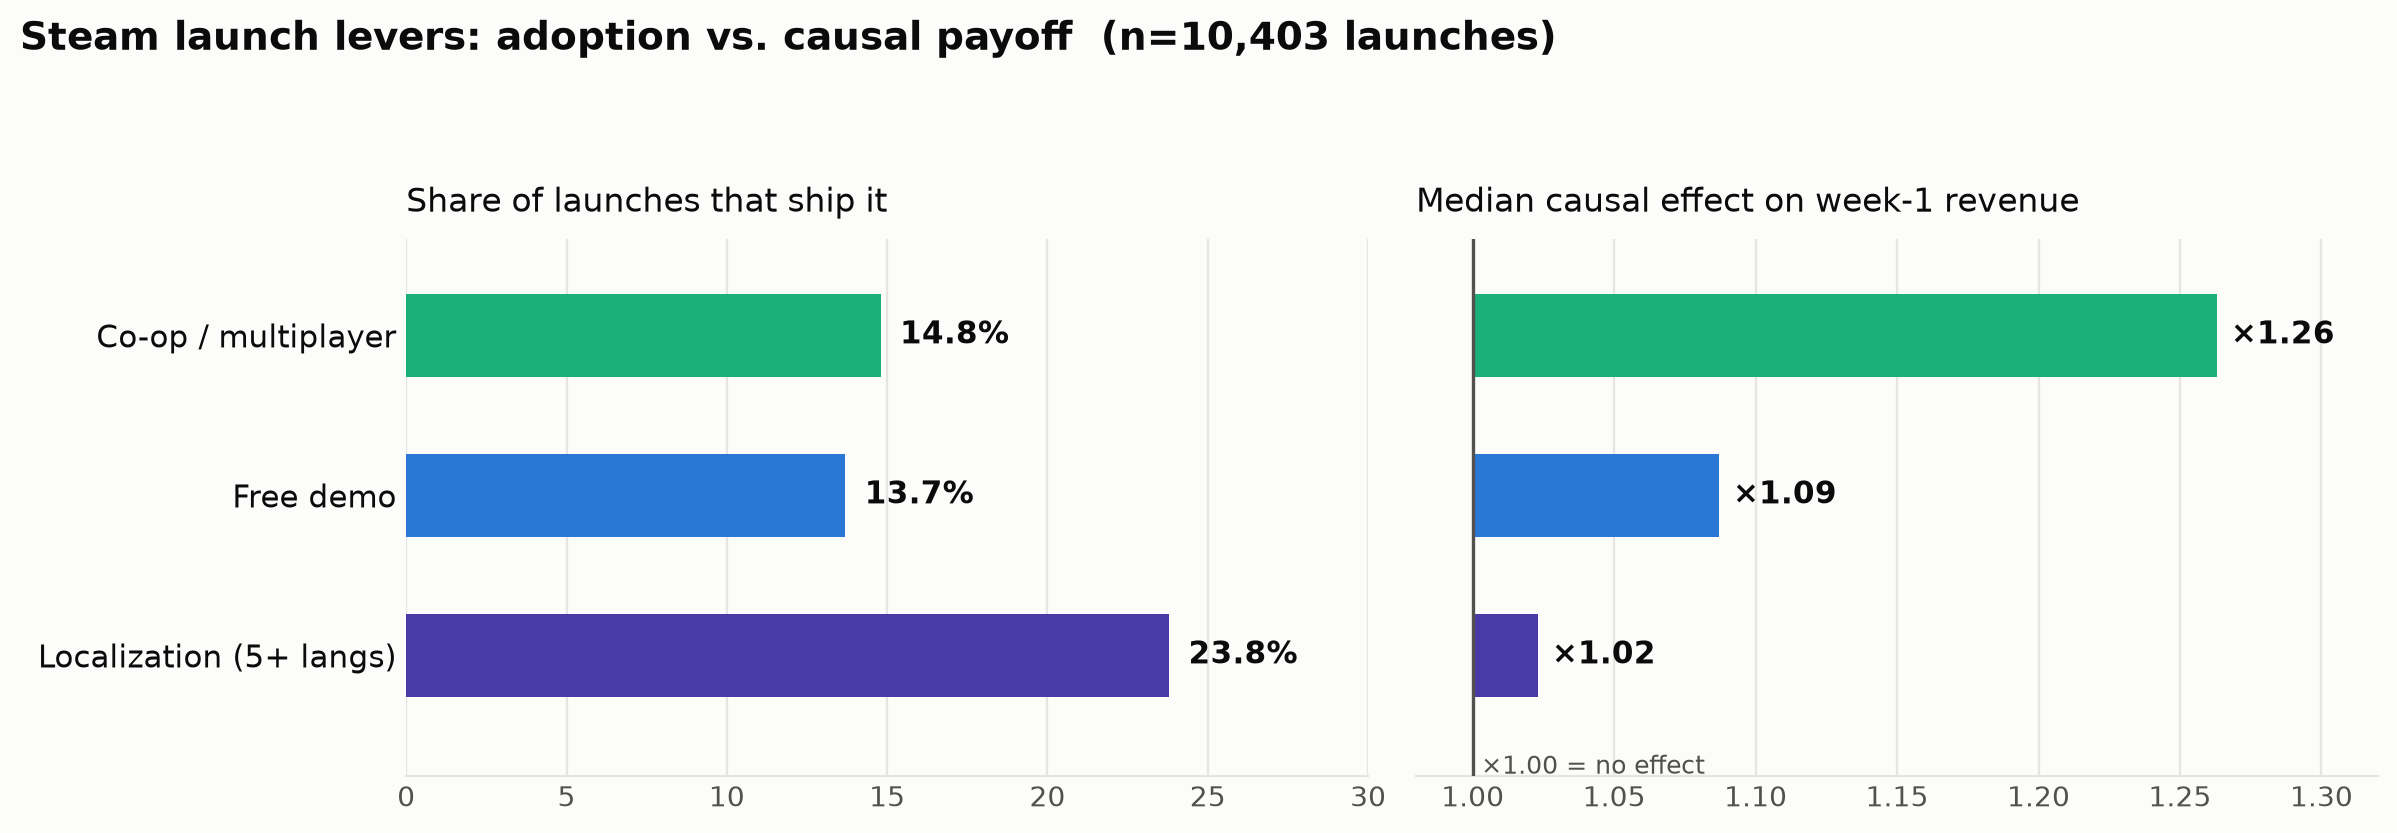
- Multiplayer/co-op is the most undersupplied revenue lever on Steam. Median causal effect: ×1.26 on week-1 revenue, positive for 95% of launches — yet only 14.8% of launches ship it.
- Demos help most games, modestly. Median ×1.09, positive for 75% — a quarter of games see no benefit.
- Localization is the overrated lever for week-1 revenue: median ×1.02, positive for just 57% of launches — statistically a coin flip.
Why "causal" is the load-bearing word
Games with multiplayer earn more for boring reasons too — bigger teams, bigger marketing budgets, genres with bigger audiences. A raw comparison inherits all of that. Causal forests estimate the conditional average treatment effect: the expected revenue difference for a game with your follower count, genre cluster, and tag profile. Each estimate carries a 95% confidence interval from the influence function — the same estimates that power the what-if levers in our forecaster.
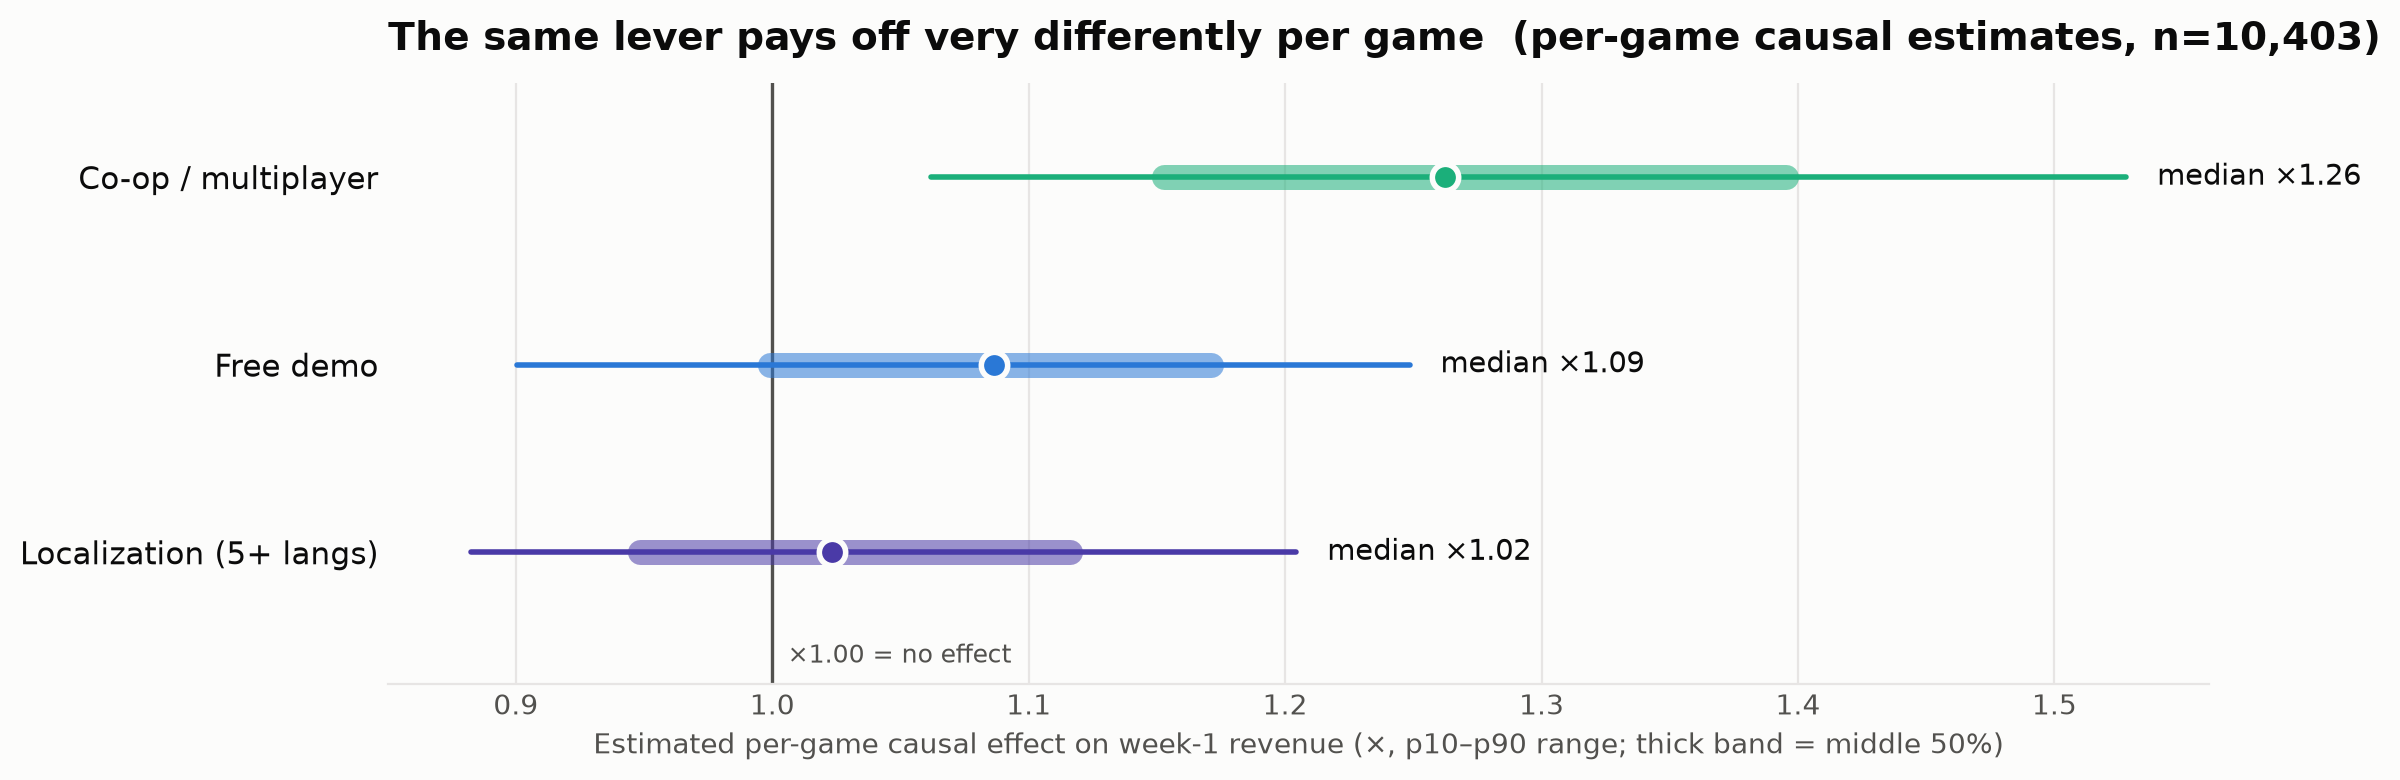
The same lever is not the same bet for every game
The median hides the spread. Per-game estimated effects vary widely — a demo is a clear win for some profiles and a wash for others. If someone sells you a flat "demos add X%", they are averaging over games that are not yours.
The numbers
| Lever | Ships with it | Median causal effect (week-1) | Positive for |
|---|---|---|---|
| Co-op / multiplayer | 14.8% | ×1.26 | 95.4% of launches |
| Free demo | 13.7% | ×1.09 | 74.8% |
| Localization (5+ languages) | 23.8% | ×1.02 | 57.4% |
What this does — and does not — say
- Population: 10,403 launches with measurable revenue outcomes — a survivorship-biased subset of all Steam releases. Multiplicative effects are the robust story; absolute dollar figures from this panel would overstate the typical release.
- Outcomes are review-count-derived revenue estimates (the standard Boxleiter-class approach), not disclosed sales.
- Week-1 revenue only. Localization plausibly earns its keep in the long tail and via regional pricing; that is outside this estimate.
- Effects are conditional, not free money. "Add multiplayer" costs engineering-years for some games. The estimate prices the revenue side only — and the per-game spread (chart 2) is exactly why we ship per-game estimates in the forecaster rather than one number for everyone.
Steam Launch Forecaster (2026). What Actually Moves Steam Launch Revenue? Causal Benchmarks From 10,403 Launches. https://steamforecast.app/reports/steam-launch-lever-benchmarks
Data + charts: CC BY 4.0 — reuse freely with attribution (a link to this page). Questions or a dataset request: [email protected].
Want these estimates for your game? The free forecaster runs a calibrated P10–P90 revenue cone on any Steam app ID (84% realized coverage, n=6,422 held-out launches). The $299 launch report adds the wishlist-aware cone and every per-game what-if lever with confidence intervals.
Method: Wager-Athey causal forests (econml) per treatment (T_has_demo, T_supports_coop, T_languages_high) over public-storefront covariates (followers, recommendations, genre cluster, tag counts); 95% CIs via the influence function. Full modeling approach: /methodology. Related: how much Steam games make · wishlist benchmarks reality check.